Is the server slow, or is it my page content?
You can run the Page Insights test on the cPanel login page to test the server’s performance for a very simple page: http://mydomain.com**/cpanel/.**
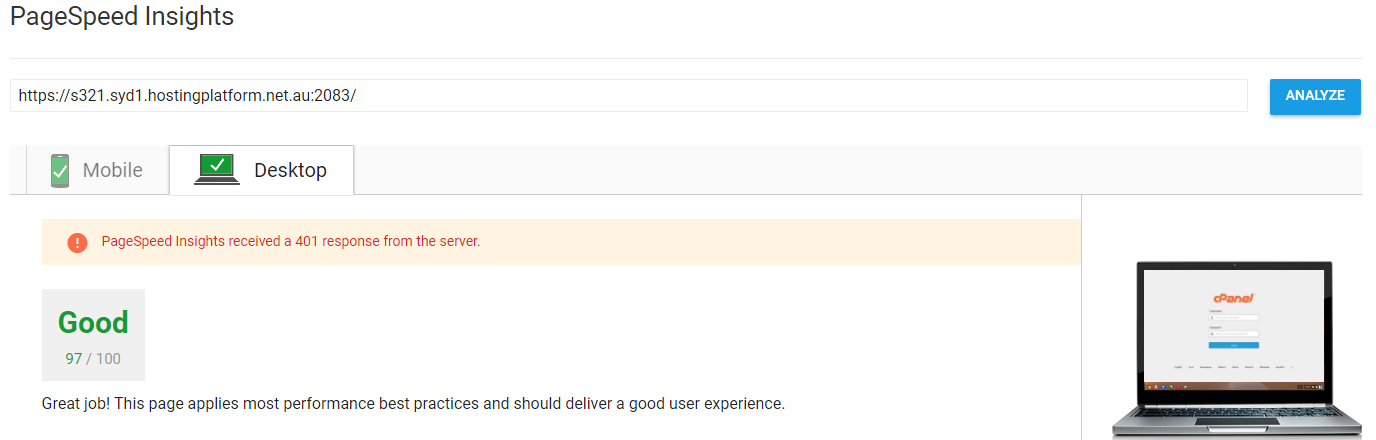 Running this test gives you true insight into the server performance. It completely takes your site, your resources, and everything else out of the picture. If this comes back as anything longer than 1 second, you know there is an issue with the server itself. Although we actively work to keep all servers with low load, if you notice this goes on for longer than 15 minutes, please get in touch with the Technical Support team. If the result comes back, “Your server responded quickly” — you can pretty much rule out the server being slow, and that there must be something related to your site causing the slowdown. So, the site is somehow causing the server to respond slowly. Some things to check:
- Check you aren’t hitting your resource limit: cPanel > CPU and Concurrent Connection Usage. From here, you can inspect your account’s performance usage. If you find the account is being “limited” or constantly running very close to 100% resource consumption, you may need to upgrade your account to more resources.
- Try disabling all your plugins and rerunning the test: Having dozens of plugins all running simultaneously can cause delays in site performance; try disabling them all and rerunning the test to see if the response time improves or even changes.
- Try loading the site into your browser: It seems strange, but does the actual site load and feel slow? Is it sluggish? The most important test is how the site feels and loads. Visitors to your site aren’t going to notice the difference between a response time of 200ms or 600ms. They will, however, notice if your images are 2MB each and take forever to load.