What is Time To First Byte (TTFB)?
In short, TTFB indicates how long it took the webserver to send back a response to the web browser.How to measure TTFB
A great way to measure TTFB is to use Google Page Speed Tools, Pingdom, or GTMetrix. It will provide you with the server’s TTFB and several other valuable metrics.Overall website load time
One important thing to note when talking about TTFB is that it’s usually affected most by the time it takes to compress your website’s content before it’s sent off to the web browser. And compressing your website content can often lower the website’s overall load time. CloudFlare writes a great article that explains this in more detail. It explains that although the TTFB might be a bit higher because of compression, the overall load time is lowered by doing this, making the TTFB metric less meaningful.Testing the server’s response time
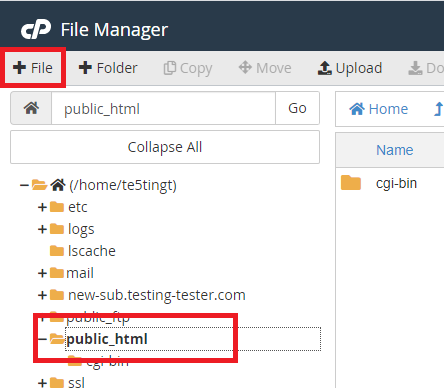
Before proceeding, it’s a good idea to find out how fast the server can respond. A simple way to test this would be to create a simple test HTML. Here are the steps you need to take to create a simple test file:- Log in to cPanel.
- Click on File Manager.
- Navigate to the public_html folder.
- Click on the +File button.
- In the New File dialogue box that appears, input any file name (e.g. “test-file.html”).
- Click Create New File.
- Right-click on the new file and click Edit, then click Edit in the dialogue box that appears.
- Input some introductory text into the file (e.g. “Hello, world!”), then click Save Changes.
Lowering TTFB
To lower your TTFB, first, we need to understand all the different factors that can affect this metric.First, a request is sent to the server.
A few things can slow this down, such as network latency and DNS lookup times, as well as the distance between the user and the server. Unfortunately, we don’t have much control over these factors, except for the server’s location. VentraIP’s servers are within Australia, so they’re already nice and close.Then, server-side processing occurs.
Many things will happen here that can affect the server’s TTFB, such as:- Database lookups
- Loading your website’s theme and associated content
- Processing core website scripts
- Processing 3rd party plugins and scripts
- Compression of content before it’s sent back to the web browser (e.g., images, CSS/JS files, content)
Finally, the response arrives at the end user’s web browser.
Again, this is something we don’t have a lot of control over, as it can be affected by the end user’s connection speed and physical location. Even if their connection speed slows things down, it will still be considered when TTFB is calculated. The key to lowering TTFB is to work with what you do have control over—the website itself. An excellent place to start would be to leverage LiteSpeed Cache to reduce your TTFB and the overall load time of your website. Our testing shows that this can work wonders for most websites, speeding them up significantly.Other things you can do to lower TTFB
- Lowering the number of plugins and 3rd party scripts used by your website—some poorly optimized plugins and themes can cause your website to slow down quite a bit.
- Lowering the amount of content that needs to be sent back to the web browser—website content will be compressed before it’s sent off to the web browser. The more content requiring compression, the higher your TTFB will be.
- Optimizing database lookups—the time it takes for your website to grab content from its database can cause the website’s overall load time. You may need to speak to a professional web developer about making these kinds of optimizations.