- Login to cPanel
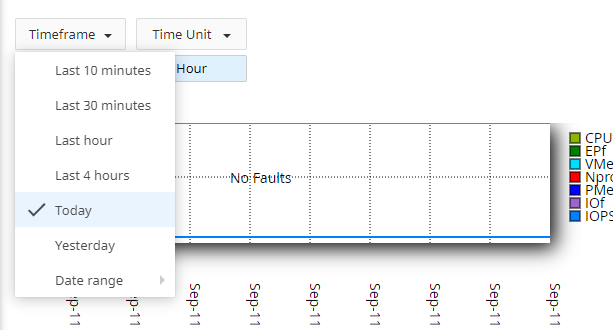
- Click on Resource Usage under Metrics
- Click Current Usage
 If you’re not sure what to do when you find that you’re hitting your limits, we have a separate guide on how to do that.
 If you’re not sure what to do when you find that you’re hitting your limits, we have a separate guide on how to do that.